Load Packages
1
2
3
4
5
| import numpy as np
from PIL import Image
import matplotlib.pyplot as plt
%matplotlib inline
|
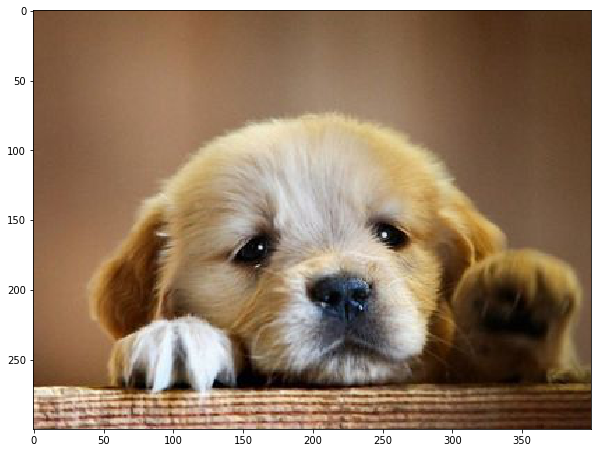
이미지 불러오기
1
2
3
4
5
6
7
8
9
| path = 'images/dog.jpg'
image_pil = Image.open(path)
image = np.array(image_pil)
image.shape
(300, 400, 3)
|
이미지 들여다 보기
1
2
3
4
| np.min(image), np.max(image)
(0, 255)
|
그래프로 시각화하기
1
2
| plt.hist(image.ravel(), 256, [0, 256])
plt.show()
|
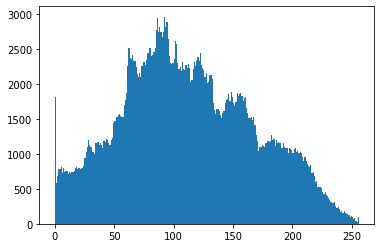
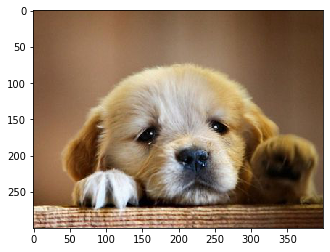
그림 나타내기
1
2
| plt.imshow(image)
plt.show()
|
이미지 흑백으로 열기
1
2
3
4
5
6
7
| image_pil = Image.open(path).convert("L")
image_bw = np.array(image_pil)
image_bw.shape
(300, 400)
|
흑백 이미지 열기
1
2
| plt.imshow(image_bw, 'gray')
plt.show()
|
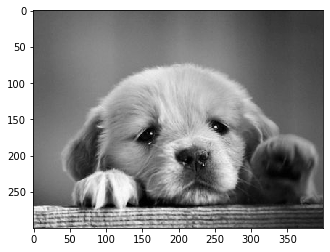
다른 색상으로 cmap 표현하기
gray scale
1
2
| plt.imshow(image_bw, 'gray')
plt.show()
|
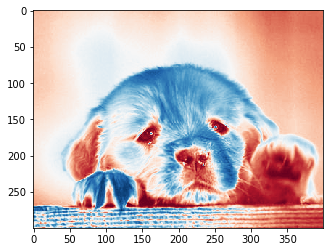
RdBu(Red and Blue)
1
2
| plt.imshow(image_bw, 'RdBu')
plt.show()
|
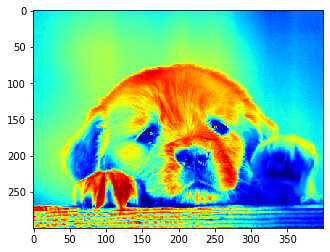
jet
색상 값이 높을수록 빨간색, 낮을수록 파란색으로 표현한다.
1
2
| plt.imshow(image_bw, 'jet')
plt.show()
|
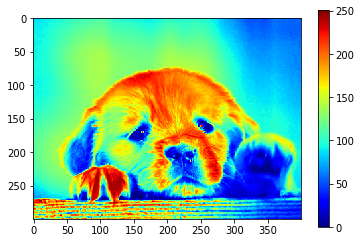
Colorbar 추가하기
1
2
3
| plt.imshow(image_bw, 'jet')
plt.colorbar()
plt.show()
|
이미지 설정
이미지 보기 사이즈를 조절한다.
1
2
3
| plt.figure(figsize=(10, 10))
plt.imshow(image)
plt.show()
|
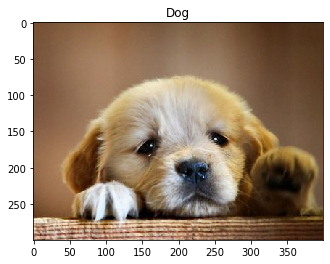
이미지에 제목 추가
1
2
3
| plt.title('Dog')
plt.imshow(image)
plt.show()
|
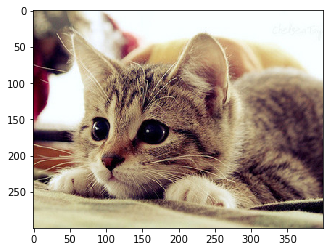
두 번째 이미지 열기
1
2
3
4
5
6
7
| cat_path = 'images/cat.jpg'
cat_pil = Image.open(cat_path)
cat_image = np.array(cat_pil)
plt.imshow(cat_image)
plt.show()
|
두 번째 이미지를 첫 번째 이미지 모양에 맞추기
준비
먼저 opencv 패키지를 설치한다.
1
| $ pip install opencv-python
|
1
2
3
4
5
6
7
8
|
import cv2
dog_image = cv2.resize(image, (400, 300))
dog_image.shape, cat_image.shape
((300, 400, 3), (300, 400, 3))
|
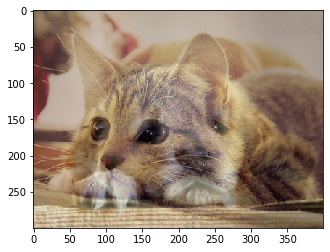
이미지 합치기
1
2
3
| plt.imshow(dog_image)
plt.imshow(cat_image, alpha=0.5)
plt.show()
|
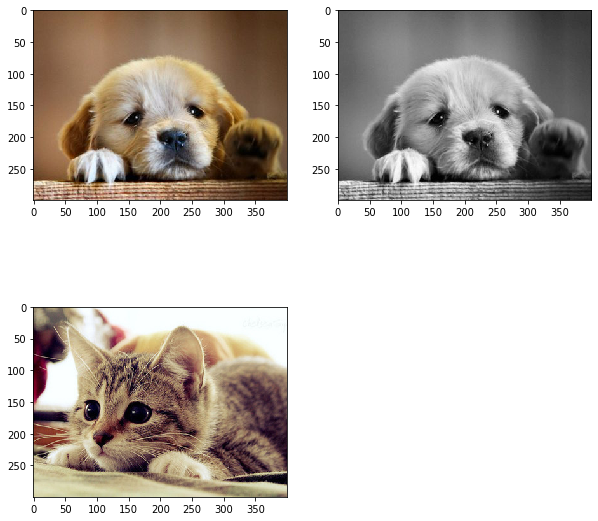
Subplot
1
2
3
4
5
6
7
8
| plt.figure(figsize=(10, 10))
plt.subplot(221)
plt.imshow(dog_image)
plt.subplot(222)
plt.imshow(image_bw, 'gray')
plt.subplot(223)
plt.imshow(cat_image)
plt.show()
|