Load Packages
1 | import numpy as np |
데이터 불러오기
TensorFlow 에서 제공해주는 데이터셋(MNIST) 예제 불러오기다.
1 | from tensorflow.keras import datasets |
Image Dataset 들여다보기
불러온 데이터셋에서 이미지 데이터 하나만 뽑아서 시각화한다.
데이터 하나만 뽑기
1 | image = train_x[0] |
시각화 하기
1 | plt.imshow(image, 'gray') |
Channel 관련
[Batch Size, Height, Width, Channel]
Gray Scale 이면 1, RGB 이면 3으로 만들어줘야 한다.
데이터 차원수 늘리기(numpy)
1 | # -1 인 경우 마지막에 차원을 늘린다는 의미입니다. |
데이터 차원수 늘리기 (tensorflow)
1 | new_train_x = tf.expand_dims(train_x, -1) |
TensorFlow 공식홈페이지에 나온 방법이다.
1 | new_train_x =train_x[..., tf.newaxis] |
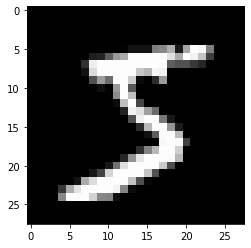
다시 시각화 하기
주의사항: matplotlib로 이미지 시각화 할 때 gray scale의 이미지는 3번째 dimension이 없으므로, 2개의 dimension으로 차원 조절해서 넣어줘야 한다.
1 | display = new_train_x[0, :, :, 0] |
1 | plt.imshow(display, 'gray') |
Label Dataset 들여다보기
Label 하나를 열어서 Image와 비교하여 제대로 들어갔는지, 어떤 식으로 저장 되어 있는지 확인한다.
Label 하나만 뽑아보기
1 | train_y[0] |
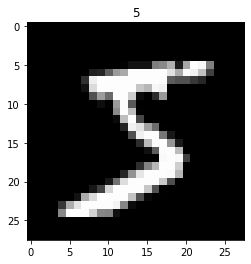
Lebel 시각화 하기
1 | plt.title(train_y[0]) |
OneHot Encoding
컴퓨터가 이해할 수 있는 형태로 변환해서 Label을 주도록 한다.
1 | # 1 |
1을 예시로 one hot encoding 하기
1 | from tensorflow.keras.utils import to_categorical |
Label 확인해서 to_categorical 사용
1 | label = train_y[0] |
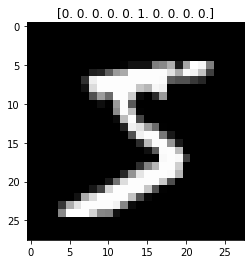
one hot encoding으로 바꾼 것과 이미지 확인
1 | plt.title(label_onehot) |